VR(T) time decay and term adjusted Vega columns in Risk Navigator (SM)
Background
Risk Navigator (SM) has two Adjusted Vega columns that you can add to your report pages via menu Metrics → Position Risk...: "Adjusted Vega" and "Vega x T-1/2". A common question is what is our in-house time function that is used in the Adjusted Vega column and what is the aim of these columns. VR(T) is also generally used in our Stress Test or in the Risk Navigator custom scenario calculation of volatility index options (i.e VIX).
Abstract
Implied volatilities of two different options on the same underlying can change independently of each other. Most of the time the changes will have the same sign but not necessarily the same magnitude. In order to realistically aggregate volatility risk across multiple options into a single number, we need an assumption about relationship between implied volatility changes. In Risk Navigator, we always assume that within a single maturity, all implied volatility changes have the same sign and magnitude (i.e. a parallel shift of volatility curve). Across expiration dates, however, it is empirically known that short term volatility exhibits a higher variability than long term volatility, so the parallel shift is a poor assumption. This document outlines our approach based on volatility returns function (VR(T)). We also describe an alternative method developed to accommodate different requests.
VR(T) time decay
We applied the principal component analysis to study daily percentage changes of volatility as a function of time to maturity. In that study we found that the primary eigen-mode explains approximately 90% of the variance of the system (with second and third components explaining most of the remaining variance being the slope change and twist). The largest amplitude of change for the primary eigenvector occurs at very short maturities, and the amplitude monotonically decreases as time to expiration increase. The following graph shows the main eigenvector as a function of time (measured in calendar days). To smooth the numerically obtained curve, we parameterize it as a piecewise exponential function.
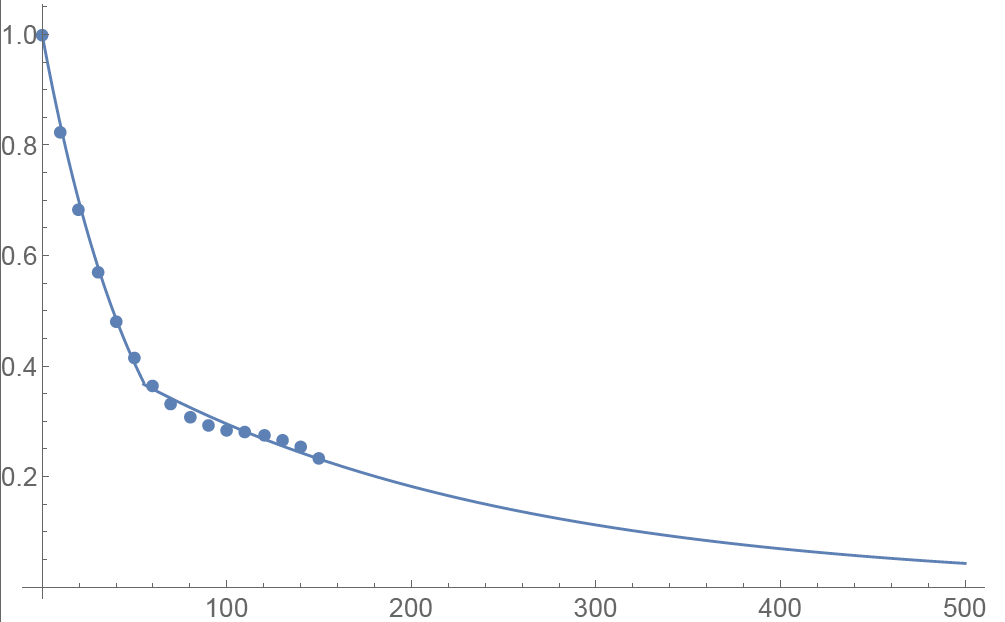
Functional Form: Amplitude vs. Calendar Days
To prevent the parametric function from becoming vanishingly small at long maturities, we apply a floor to the longer term exponential so the final implementation of this function is:

where bS=0.0180611, a=0.365678, bL=0.00482976, and T*=55.7 are obtained by fitting the main eigenvector to the parametric formula.
Inverse square root time decay
Another common approach to standardize volatility moves across maturities uses the factor 1/√T. As shown in the graph below, our house VR(T) function has a bigger volatility changes than this simplified model.
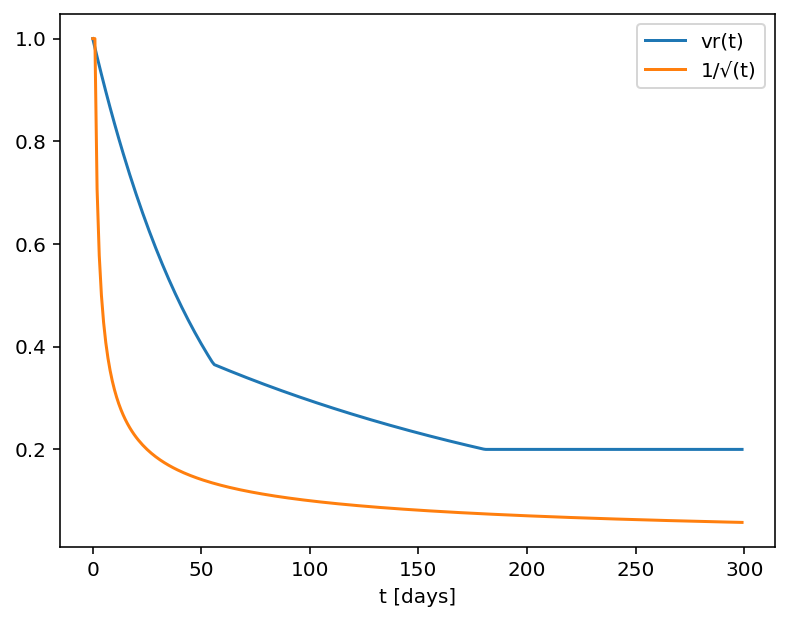
Time function comparison: Amplitude vs. Calendar Days
Adjusted Vega columns
Risk Navigator (SM) reports a computed Vega for each position; by convention, this is the p/l change per 1% increase in the volatility used for pricing. Aggregating these Vega values thus provides the portfolio p/l change for a 1% across-the-board increase in all volatilities – a parallel shift of volatility.
However, as described above a change in market volatilities might not take the form of a parallel shift. Empirically, we observe that the implied volatility of short-dated options tends to fluctuate more than that of longer-dated options. This differing sensitivity is similar to the "beta" parameter of the Capital Asset Pricing Model. We refer to this effect as term structure of volatility response.
By multiplying the Vega of an option position with an expiry-dependent quantity, we can compute a term-adjusted Vega intended to allow more accurate comparison of volatility exposures across expiries. Naturally the hoped-for increase in accuracy can only come about if the adjustment we choose turns out to accurately model the change in market implied volatility.
We offer two parametrized functions of expiry which can be used to compute this Vega adjustment to better represent the volatility sensitivity characteristics of the options as a function of time to maturity. Note that these are also referred as 'time weighted' or 'normalized' Vega.
Adjusted Vega
A column titled "Vega Adjusted" multiplies the Vega by our in-house VR(T) term structure function. This is available any option that is not a derivative of a Volatility Product ETP. Examples are SPX, IBM, VIX but not VXX.
Vega x T-1/2
A column for the same set of products as above titled "Vega x T-1/2" multiplies the Vega by the inverse square root of T (i.e. 1/√T) where T is the number of calendar days to expiry.
Aggregations
Cross over underlying aggregations are calculated in the usual fashion given the new values. Based on the selected Vega aggregation method we support None, Straight Add (SA) and Same Percentage Move (SPM). In SPM mode we summarize individual Vega values multiplied by implied volatility. All aggregation methods convert the values into the base currency of the portfolio.
Custom scenario calculation of volatility index options
Implied Volatility Indices are indexes that are computed real-time basis throughout each trading day just as a regular equity index, but they are measuring volatility and not price. Among the most important ones is CBOE's Marker Volatility Index (VIX). It measures the market's expectation of 30-day volatility implied by S&P 500 Index (SPX) option prices. The calculation estimates expected volatility by averaging the weighted prices of SPX puts and calls over a wide range of strike prices.
The pricing for volatility index options have some differences from the pricing for equity and stock index options. The underlying for such options is the expected, or forward, value of the index at expiration, rather than the current, or "spot" index value. Volatility index option prices should reflect the forward value of the volatility index (which is typically not as volatile as the spot index). Forward prices of option volatility exhibit a "term structure", meaning that the prices of options expiring on different dates may imply different, albeit related, volatility estimates.
For volatility index options like VIX the custom scenario editor of Risk Navigator offers custom adjustment of the VIX spot price and it estimates the scenario forward prices based on the current forward and VR(T) adjusted shock of the scenario adjusted index on the following way.
- Let S0 be the current spot index price, and
- S1 be the adjusted scenario index price.
- If F0 is the current real time forward price for the given option expiry, then
- F1 scenario forward price is F1 = F0 + (S1 - S0) x VR(T), where T is the number of calendar days to expiry.
風險漫遊:替代保證金計算器
概述:
隨著市場條件的變化,IB 會經常評估保證金水平並根據需要在法定最低保證金要求的基礎
上提高保證金要求。為幫助客戶瞭解此類保證金變動對其投資組合的影響,我們在“風險漫
遊”應用中提供了一個被稱為“替代保證金計算器”的功能。下文列出了創建“假設情境”
投資組合的步驟,用以評估保證金調整帶來的影響。
第一步:打開全新的“假設情境”投資組合
在標準模式TWS交易平臺內,依次選擇“分析工具(Analytical Tools)”、“風險漫遊(Risk
Navigator)”和“打開新的假設情境(Open New What-If)”菜單選項(見圖1)。
圖1
.png)
在魔方模式TWS 交易平臺下,依次選擇“新窗口(New Window)”、“風險漫遊(Risk Navigator)”和“打開新的假設情境(Open New What-If)”菜單選項。
第二步:定義起始投資組合
跳出的彈出窗口(圖2)會詢問您是想用您當前的投資組合來創建假設投資組合還是重新創
建一個投資組合。點擊“是”將把已有的頭寸下載至新的“假設情境”投資組合。
圖2
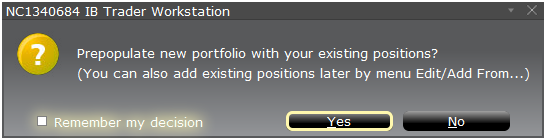
點擊“否”將打開一個沒有頭寸的“假設情境”投資組合。
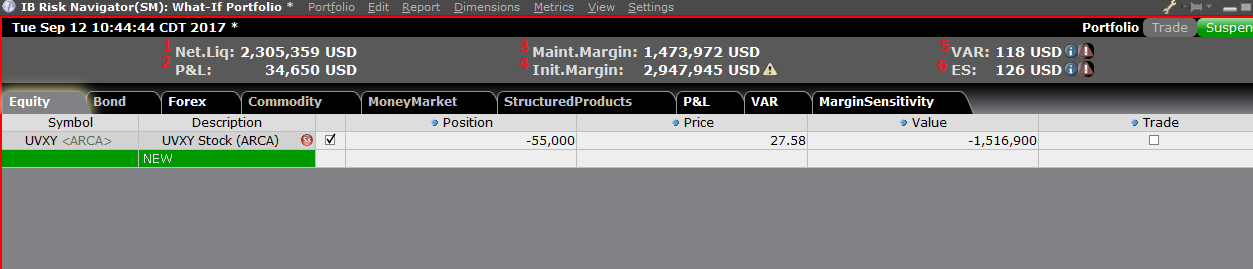
風險控制面板
“風險控制面板”位於產品標簽組的頂部,“假設情境”投資組合和真實活躍的投資組合均
可使用。“假設情境”投資組合可按需計算各類數值。用戶可通過該控制面板一目了然地查
看以下賬戶信息:
1) 淨清算價值:賬戶的總淨清算價值
2) 盈虧:整個投資組合的每日總盈虧
3) 維持保證金:當前總的維持保證金
4) 初始保證金:總的初始保證金要求
5) 風險價值(VAR):整個投資組合的風險價值
6) 預期虧損(ES):預期虧損(平均風險價值)是投資組合在最差的情境下的預期回報
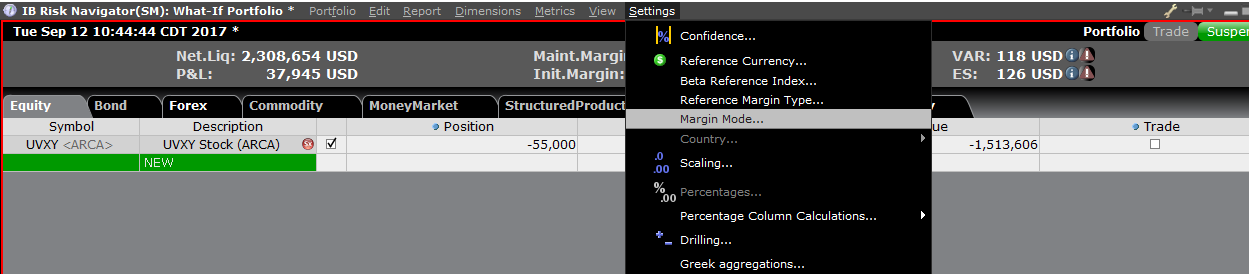
替代保證金計算器
在“設置(Setting)”菜單下點擊“保證金模式(Margin Mode)”(圖3)可打開替代保
證金計算器。該工具會顯示當保證金調整被完全實施後投資組合的保證金要求會發生什麼變
化。
圖3
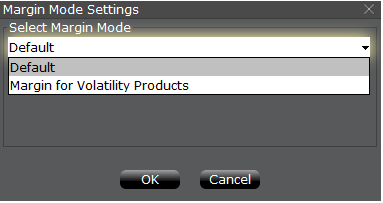
第三步:選擇保證金模式設置
出現一個名為“保證金模式設置”的彈出窗口(圖4)。您可使用該窗口中的下拉菜單將保
證金計算方式從“默認”(即當前政策)變更為新標題的保證金設置(即新的保證金政策)。
選擇完畢後點擊窗口中的“確定”按鈕。
圖4
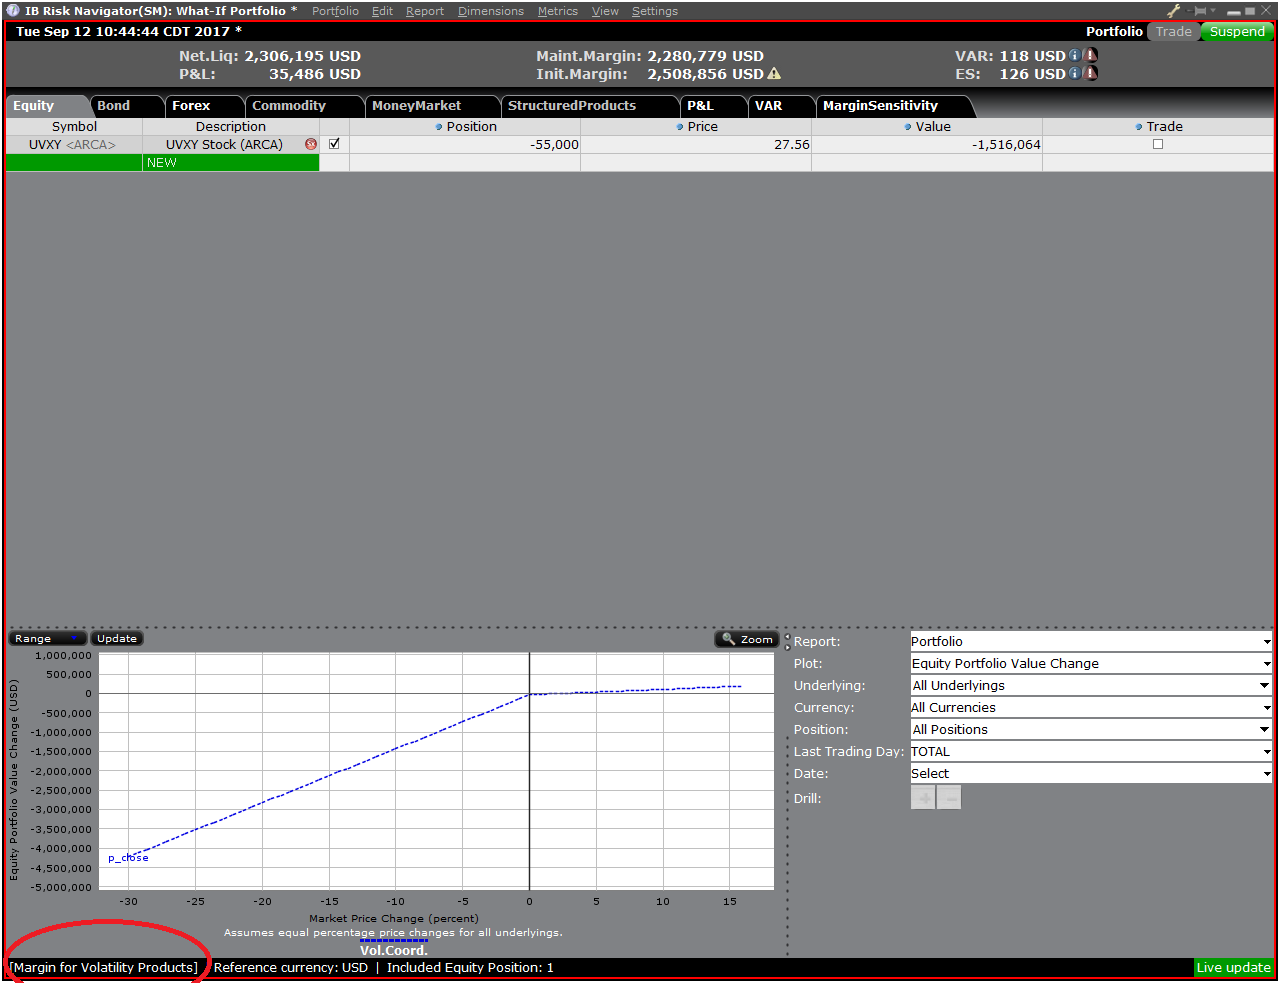
設置好新的保證金模式後,風險漫遊控制面板會自動更新以反映您的選擇。您可在新舊保證
金模式設置中切換。注意,當前的保證金模式會在“風險漫遊”窗口的左下角顯示(圖5)。
圖5
第四步:添加頭寸
要在“假設情境”投資組合中添加頭寸,點擊標題叫“新”的綠色行,然後依次輸入底層產
品的代碼(圖6)、選擇產品類型(圖7)及輸入頭寸數量(圖8)
圖6
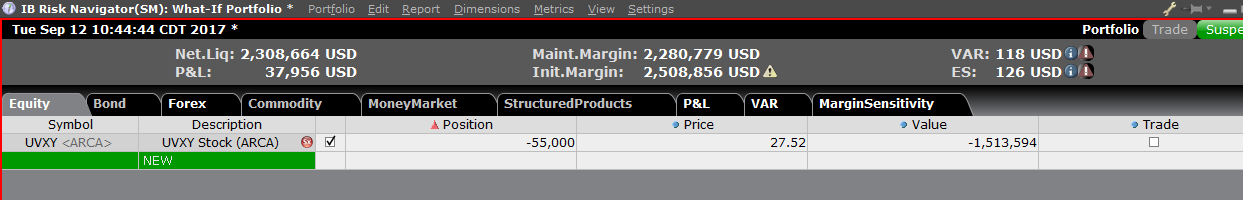
圖7
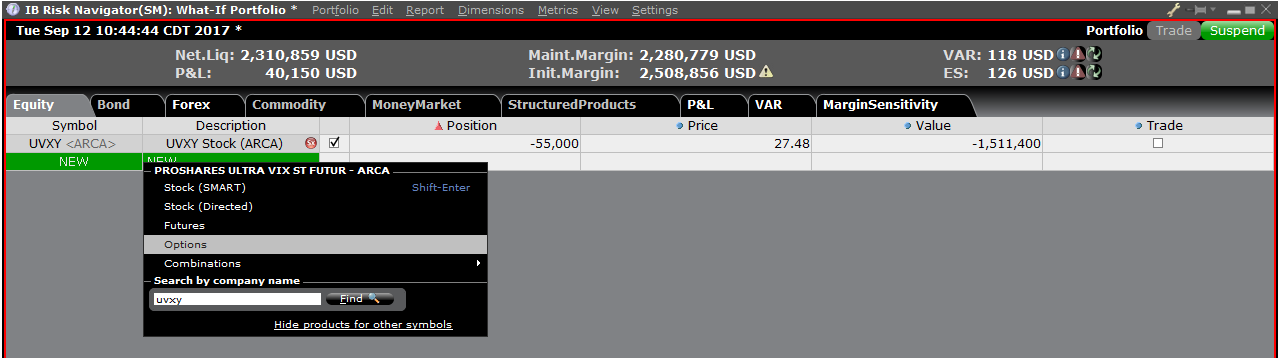
圖8
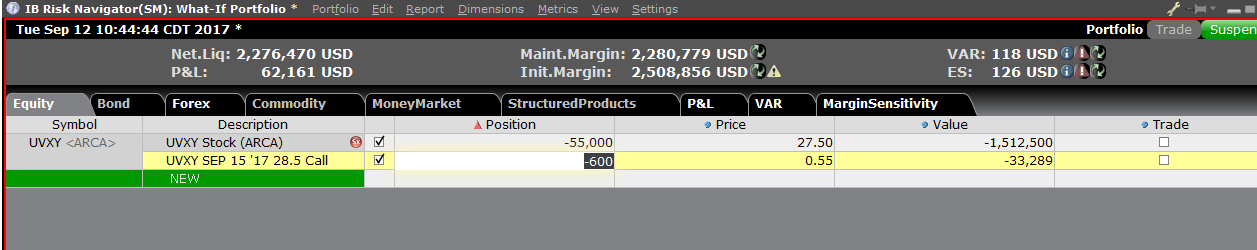
您可修改頭寸以查看保證金會發生什麼變化。在您修改了頭寸後,您需要點擊保證金數字右
邊重新計算的圖標 (![]() ) 以更新數值。只要出現了該圖標就表明保證金數據沒有根據“假
) 以更新數值。只要出現了該圖標就表明保證金數據沒有根據“假
設情境”投資組合的內容更新至最新。
Order Preview - Check Exposure Fee Impact
IB provides a feature which allows account holders to check what impact, if any, an order will have upon the projected Exposure Fee. The feature is intended to be used prior to submitting the order to provide advance notice as to the fee and allow for changes to be made to the order prior to submission in order to minimize or eliminate the fee.
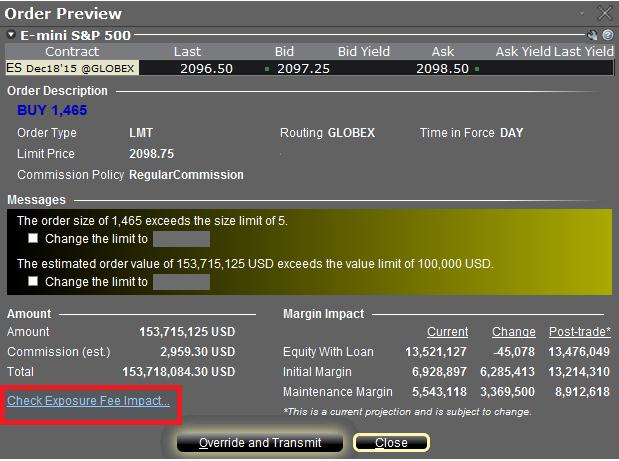
The feature is enabled by right-clicking on the order line at which point the Order Preview window will open. This window will contain a link titled "Check Exposure Fee Impact" (see red highlighted box in Exhibit I below).
Exhibit I
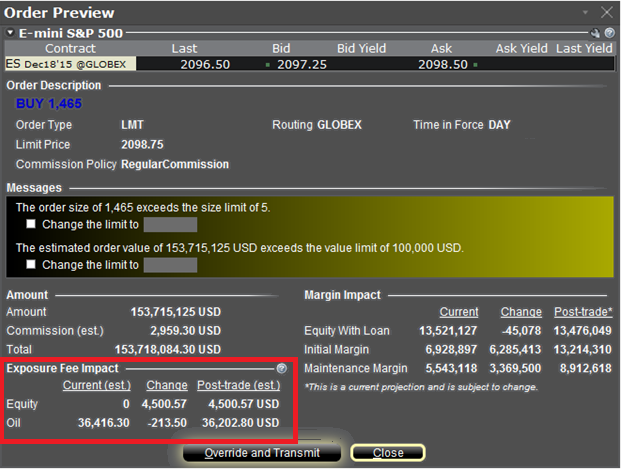
Clicking the link will expand the window and display the Exposure fee, if any, associated with the current positions, the change in the fee were the order to be executed, and the total resultant fee upon order execution (see red highlighted box in Exhibit II below). These balances are further broken down by the product classification to which the fee applies (e.g. Equity, Oil). Account holders may simply close the window without transmitting the order if the fee impact is determined to be excessive.
Exhibit II
Please see KB2275 for information regarding the use of IB's Risk Navigator for managing and projecting the Exposure Fee and KB2344 for monitoring fees through the Account Window
Important Notes
1. The Estimated Next Exposure Fee is a projection based upon readily available information. As the fee calculation is based upon information (e.g., prices and implied volatility factors) available only after the close, the actual fee may differ from that of the projection.
2. The Check Exposure Fee Impact is only available for accounts that have been charged an exposure fee in the last 30 days
Using Risk Navigator to Project Exposure Fees
IB's Risk Navigator provides a custom scenario feature which allows one to determine what effect, if any, changes to their portfolio will have to the Exposure fee. Outlined below are the steps for creating a “what-if” portfolio through assumed changes to an existing portfolio or through an entirely new proposed portfolio along with determining the resultant fee. Note that this feature is available through TWS build 971.0i and above.
.png)
.png)
.png)
.png)
.png)
.png)
.png)
Please see KB2344 for information on monitoring the Exposure fee through the Account Window and KB2276 for verifying exposure fee through the Order Preview screen.
Important Note
1. The on-demand Exposure Fee check represents a projection based upon readily available information. As the fee calculation is based upon information (e.g., prices and implied volatility factors) available only after the close, the actual fee may differ from that of the projection.
Can I set a maximum dollar exposure for my account?
Unless an account holds solely long stock, bond, option or forex positions which have been paid for in full (i.e., no margin) and/or contains limited risk derivative positions such as option spreads, it is at risk of losing more than the original investment.
In the case of portfolios where the risk is indeterminable, there is no mechanism whereby the account holder can specify, at the portfolio level, a maximum dollar threshold of losses which, if reached, would limit their liability. IB does, however, provide a variety of tools and settings designed to assist account holders with managing and monitoring their exposure, including specialized order types, alerts and the Risk Navigator. A brief overview of each is provided below:
Order Types
Account holders may manage exposure on an individual trade level through several order types designed to limit risk. These order types include, but are not limited to: Stop, Adjustable Stop, Stop Limit, Trailing Stop and Trailing Stop Limit Orders. All of these order types allow you to specify an exit level for your individual positions based on your risk tolerance. For example, an account holder long 200 shares of hypothetical stock XYZ at an average price of $20.00 seeking to limit their loss to $500.00 could create a Stop Limit order having a Stop Price of $18.00 (the price at which a limit sell order is triggered) and a Limit Price of $17.50 (the lowest price at which the shares would be sold). It's important to note, however, that while a Stop Limit eliminates the price risk associated with a Stop order where the execution price is not guaranteed, it exposes the account holder to the risk that the order may never be filled even if the Stop Price is reached. For instructions on creating a Stop Limit order, click here.
Alerts
Alerts provide account holders the ability to specify events or conditions which, if met, trigger an action. The conditions can be based on time, trades that occur in the account, price levels, trade volume, or a margin cushion. For example, if the account holder wanted to be notified if their account was nearing a margin deficiency and forced liquidation, an alert could be set up to send an email if the margin cushion fell to some desired percentage, say 10% of equity. The action may consist of an email or text notification or the triggering of a risk reducing trade. For instructions on creating an Alert, click here.
Risk Navigator
The Risk Navigator is a real-time market risk management platform contained within the TraderWorkstation, which provides the account holder with the ability to create 'what-if' scenarios to measure exposure given user-defined changes to positions, prices, date and volatility variables which may impact their risk profile. For information on using an Risk Navigator, click here.
IB's Risk Navigator Session 3 - What-if Scenario
How to create a What-if Scenario using IB's Risk Navigator
Click here to watch: Risk Navigator Session 1 - Introduction
Click here to watch: Risk Navigator Session 2 - Custom Scenario
For detailed information on how to create What-if scenarios please refer to the TWS Online User's Guide.
IB's Risk Navigator Session 2 - Custom Scenario
How to create a custom scenario using IB's Risk Navigator.
Click here to view: IB's Risk Navigator Session 1 - Introduction
Click here to view: IB's Risk Navigator Session 3 - What-if Scenario
For detailed information please refer to the TWS Online User's Guide.