期權第一至第四層級
什麽是期權交易許可的層級?
IBKR新推出了兩種更低層級的期權交易許可,即第一和第二層級交易許可,使目前無法獲得“有限”或“完整”期權交易許可的客戶可交易期權。“有限”交易許可目前被稱爲第三層級,而“完整”交易許可則被視爲第四層級。
賬戶可交易的期權策略類型取决于賬戶獲得的交易許可層級。不同的層級如下:
|
層級 |
支持的期權策略 |
|
第一層級 |
允許交易持保看漲期權,即在做空看漲期權的同時持有相等數量的底層證券。 |
|
第二層級 |
允許交易FINRA法規2360定義的持保期權持倉,但有額外的限制,即期權多頭的到期日不得早于價差策略中期權空頭的到期日。 |
|
第三層級 |
允許交易最大損失風險有限的期權策略。 |
|
第四層級 |
允許交易所有期權策略。 |
要瞭解各層級允許交易的期權組合舉例,請見下表:
|
策略 |
層級要求 |
|
持保看漲/持保籃子看漲 |
第一層級 |
|
買股票賣買權(Buy Write) |
第一層級 |
|
做多期權持倉 |
第二層級 |
|
做多看漲 |
第二層級 |
|
做多看跌 |
第二層級 |
|
持保看跌 |
第二層級 |
|
保護性看漲 |
第二層級 |
|
保護性看跌 |
第二層級 |
|
做多跨式 |
第二層級 |
|
做多寬跨式套利 |
第二層級 |
|
轉換 |
第二層級 |
|
做多看漲價差 |
第二層級 |
|
做多看跌價差 |
第二層級 |
|
做多鐵鷹 |
第二層級 |
|
做多盒子價差 |
第二層級 |
|
領口 |
第二層級 |
|
做空領口 |
第二層級 |
|
做空看跌 |
第三層級 |
|
合成 |
第三層級 |
|
逆轉 |
第三層級 |
|
做空看漲價差 |
第三層級 |
|
做空看跌價差 |
第三層級 |
|
做空鐵鷹 |
第三層級 |
|
做多蝶式 |
第三層級 |
|
不平衡蝶式 |
第三層級 |
|
做空蝶式 |
第三層級 |
|
日曆價差 - 借記 |
第三層級 |
|
對角價差 - 做空最先到期的邊 |
第三層級 |
|
做空裸看漲 |
第四層級 |
|
做空跨式 |
第四層級 |
|
做空寬跨式 |
第四層級 |
|
做空合成 |
第四層級 |
|
日曆價差 - 借記 |
第四層級 |
|
對角價差 - 做多最先到期的邊 |
第四層級 |
交易期權須開立何種賬戶類型?
保證金、現金和IRA/退休賬戶可申請期權交易許可。
保證金賬戶可申請任意層級的期權交易許可(第一至第四層級均可)。現金或IRA賬戶只能申請第一至第三層級,且買入所有看漲和看跌期權均要求全額支付。
請注意
- 持有現金或保證金賬戶的客戶必須在賬戶中保有2000美元(或等值的其它貨幣)的淨清算價值方可開倉或加倉已有的未持保期權倉位。
如何申請或更新我的期權交易許可?
要更新您的期權交易許可:
1. 登錄客戶端
2. 依次選擇使用者菜單(右上角的小人圖標)和設置
3. 在 賬戶設置下找到交易板塊
4. 點擊交易許可
5. 找到期權板塊,選擇添加/編輯或請求,然後選擇您想申請的許可層級幷點擊繼續。
6. 閱讀幷簽署披露與協議。
7. 點擊繼續幷根據屏幕上的提示操作。
交易許可請求可能需要24-48小時審核。有關交易許可的更多信息,請見客戶端用戶指南。
請注意
- 當一個國家/地區只有期權交易許可,該許可將包括股票和指數期權。
- 受美國證監會限制,美國法定居民通常不得在美國以外交易證券期權。證券期權指以個股、美國法定股票或任何以現金結算的寬基指數期貨爲底層的期權。
- 某些期權合約額外要求有“複雜或加杠杆的交易所交易産品”許可。
21周歲以下的人士能否交易期權?
所有客戶均可申請第一級的期權交易許可。然而,IBKR要求客戶須年滿21周歲方可申請第二至四級的許可。
申請期權交易許可須滿足哪些要求?
IBKR會向滿足最低年齡、流動淨資産、投資目標、産品知識及投資經驗要求的申請人提供不同層級的交易許可。此類信息是在開戶時收集的,或在開戶後客戶申請提升交易許可時在客戶端內收集。
如您需升級或查看您的財務信息、投資目標或投資經驗,請根據以下說明操作:
1. 登錄客戶端
2. 前往使用者菜單(右上角的小人圖標),然後點設置
3. 在賬戶設置下找到個人信息板塊
4. 點擊財務畫像來修改您的信息幷確認。
Option Levels 1-4
What are the levels of Option Trading Permissions?
IBKR introduced two new, lower levels of option trading permissions, Level 1 and 2, in order to be able to offer option trading to those who currently would not qualify for Limited or Full option trading permissions. Limited permissions are now referred to as Level 3, and Full permissions are considered Level 4.
Please note that clients of IB Canada and IB India are not eligible for option level permissions and remain with Limited or Full option trading permissions.
The type of option strategies available to trade will depend on the level of option permissions approved on the account. The various levels are as follows:
|
Level |
Option Strategies Allowed |
|
Level 1 |
Covered calls, i.e. short call vs long equal quantity of underlying, are allowed. |
|
Level 2 |
Covered Options Positions as defined by FINRA Rule 2360 are allowed with the additional restriction that the expiration date of the long option must be on or after the expiration date of the short option in a spread. |
|
Level 3 |
Option strategies that have limited maximum potential loss are allowed. |
|
Level 4 |
All option strategies are allowed. |
For examples of the types of option combinations allowed in each level, please see the following chart:
|
Strategy |
Level Requirement |
|
Covered Call/Covered Basket Call |
Level 1 |
|
Buy Write |
Level 1 |
|
Long option positions |
Level 2 |
|
Long Call |
Level 2 |
|
Long Put |
Level 2 |
|
Covered Put |
Level 2 |
|
Protective Call |
Level 2 |
|
Protective Put |
Level 2 |
|
Long Straddle |
Level 2 |
|
Long Strangle |
Level 2 |
|
Conversion |
Level 2 |
|
Long call spread |
Level 2 |
|
Long put spread |
Level 2 |
|
Long Iron Condor |
Level 2 |
|
Long Box Spread |
Level 2 |
|
Collar |
Level 2 |
|
Short Collar |
Level 2 |
|
Short Put |
Level 3 |
|
Synthetic |
Level 3 |
|
Reversal |
Level 3 |
|
Short Call Spread |
Level 3 |
|
Short Put Spread |
Level 3 |
|
Short Iron Condor |
Level 3 |
|
Long Butterfly |
Level 3 |
|
Unbalanced Butterfly |
Level 3 |
|
Short Butterfly |
Level 3 |
|
Calendar Spread - Debit |
Level 3 |
|
Diagnol Spread - Short leg expires first |
Level 3 |
|
Short Naked Call |
Level 4 |
|
Short Straddle |
Level 4 |
|
Short Strangle |
Level 4 |
|
Short Synthetic |
Level 4 |
|
Calendar Spread - Credit |
Level 4 |
|
Diagnol Spread - Long leg expires first |
Level 4 |
What account type is needed to trade options?
Option trading permissions are available for Margin, Cash and IRA/Retirement accounts.
A Margin account may request any level of option trading permissions (1-4). A Cash or IRA account may only request levels 1-3, and full payment is required for all call and put purchases.
Please Note
- Clients who maintain either a cash or margin type account must maintain net liquidating equity of at least USD 2,000 (or equivalent in other currencies) in order to establish or increase an existing uncovered options position.
How do I request or update my option trading permissions?
To update your trading permissions for options:
1. Log in to Client Portal
2. Select the User menu (head and shoulders icon in the top right corner) followed by Settings
3. Under Account Settings find the Trading section
4. Click on Trading Permissions
5. Locate Options section, select Add/Edit or Request under Options, select the level of permissions you want to request and click on CONTINUE.
6. Review and sign the disclosures and agreements.
7. Click CONTINUE and follow the prompts on screen.
Trading permission requests may take 24-48 hours to be reviewed. Find more information on trading permissions in the Client Portal Users' Guide.
Please Note
- When only Options permissions are available for a country the permissions will include both Stock and Index Options.
- US legal residents are generally excluded from trading securities options outside of the United States due to SEC restrictions. Securities options are defined as any option on an individual stock, US legal stock, or any cash settled broad based index future.
- Certain option contracts require an additional permission for "Complex or Leveraged Exchange Traded Products".
Is it possible for someone under the age of 21 to trade options?
All clients are eligible for Level 1 options trading permissions. However, IBKR requires that clients be at least 21 years of age to be eligible for level 2-4 option trading.
What are the requirements to qualify for option trading permissions?
IBKR offers various levels of trading permissions to applicants meeting minimum age, liquid net worth, investment objectives, product knowledge and prior experience qualifications. This information is gathered in the account application phase or in Client Portal if a trading permissions upgrade is requested following initial account approval.
If you need to update or review your financial information, investment objectives or experience use the button above or follow this procedure:
1. Log into Client Portal
2. Go to the User menu (head and shoulders icon in the top right corner) followed by Settings
3. Under Account Settings find the Account Profile section
4. Click on Financial Profile, rectify your information and confirm.
如何計算期權的保證金要求?
期權保證金要求的計算有多種不同的公式。使用哪種公式取决于期權類型或策略。各個策略都有著衆多詳細的公式可以應用。要瞭解相關信息,請前往IBKR網站(www.interactivebrokers.com),依次選擇“交易”>“保證金”菜單選項。在保證金要求頁面,點擊“期權”。該頁面上的表格列出了所有可能的策略和每種策略對應的保證金計算公式。
上方信息適用于股票期權和指數期權。期貨期權的保證金計算則采用完全不同的方式,即SPAN保證金系統。有關SPAN保證金系統的信息,請在該頁面搜索“SPAN”或“期貨期權保證金”。
VR(T) time decay and term adjusted Vega columns in Risk Navigator (SM)
Background
Risk Navigator (SM) has two Adjusted Vega columns that you can add to your report pages via menu Metrics → Position Risk...: "Adjusted Vega" and "Vega x T-1/2". A common question is what is our in-house time function that is used in the Adjusted Vega column and what is the aim of these columns. VR(T) is also generally used in our Stress Test or in the Risk Navigator custom scenario calculation of volatility index options (i.e VIX).
Abstract
Implied volatilities of two different options on the same underlying can change independently of each other. Most of the time the changes will have the same sign but not necessarily the same magnitude. In order to realistically aggregate volatility risk across multiple options into a single number, we need an assumption about relationship between implied volatility changes. In Risk Navigator, we always assume that within a single maturity, all implied volatility changes have the same sign and magnitude (i.e. a parallel shift of volatility curve). Across expiration dates, however, it is empirically known that short term volatility exhibits a higher variability than long term volatility, so the parallel shift is a poor assumption. This document outlines our approach based on volatility returns function (VR(T)). We also describe an alternative method developed to accommodate different requests.
VR(T) time decay
We applied the principal component analysis to study daily percentage changes of volatility as a function of time to maturity. In that study we found that the primary eigen-mode explains approximately 90% of the variance of the system (with second and third components explaining most of the remaining variance being the slope change and twist). The largest amplitude of change for the primary eigenvector occurs at very short maturities, and the amplitude monotonically decreases as time to expiration increase. The following graph shows the main eigenvector as a function of time (measured in calendar days). To smooth the numerically obtained curve, we parameterize it as a piecewise exponential function.
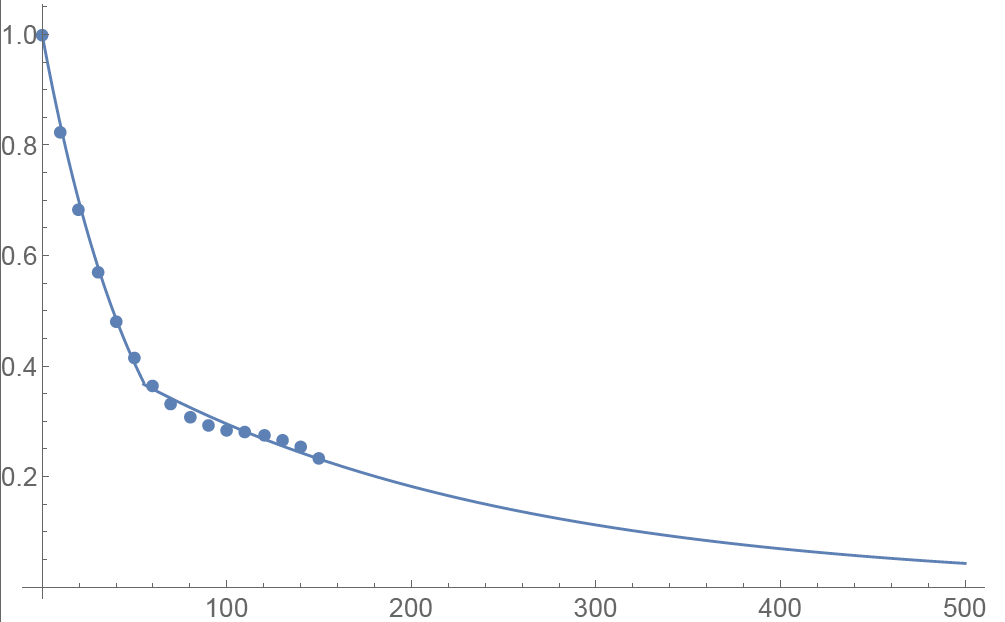
Functional Form: Amplitude vs. Calendar Days
To prevent the parametric function from becoming vanishingly small at long maturities, we apply a floor to the longer term exponential so the final implementation of this function is:

where bS=0.0180611, a=0.365678, bL=0.00482976, and T*=55.7 are obtained by fitting the main eigenvector to the parametric formula.
Inverse square root time decay
Another common approach to standardize volatility moves across maturities uses the factor 1/√T. As shown in the graph below, our house VR(T) function has a bigger volatility changes than this simplified model.
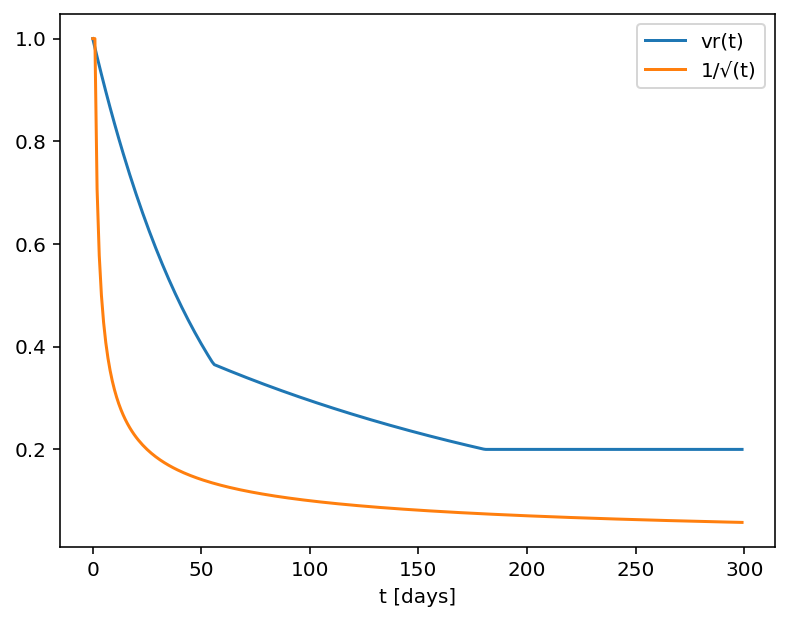
Time function comparison: Amplitude vs. Calendar Days
Adjusted Vega columns
Risk Navigator (SM) reports a computed Vega for each position; by convention, this is the p/l change per 1% increase in the volatility used for pricing. Aggregating these Vega values thus provides the portfolio p/l change for a 1% across-the-board increase in all volatilities – a parallel shift of volatility.
However, as described above a change in market volatilities might not take the form of a parallel shift. Empirically, we observe that the implied volatility of short-dated options tends to fluctuate more than that of longer-dated options. This differing sensitivity is similar to the "beta" parameter of the Capital Asset Pricing Model. We refer to this effect as term structure of volatility response.
By multiplying the Vega of an option position with an expiry-dependent quantity, we can compute a term-adjusted Vega intended to allow more accurate comparison of volatility exposures across expiries. Naturally the hoped-for increase in accuracy can only come about if the adjustment we choose turns out to accurately model the change in market implied volatility.
We offer two parametrized functions of expiry which can be used to compute this Vega adjustment to better represent the volatility sensitivity characteristics of the options as a function of time to maturity. Note that these are also referred as 'time weighted' or 'normalized' Vega.
Adjusted Vega
A column titled "Vega Adjusted" multiplies the Vega by our in-house VR(T) term structure function. This is available any option that is not a derivative of a Volatility Product ETP. Examples are SPX, IBM, VIX but not VXX.
Vega x T-1/2
A column for the same set of products as above titled "Vega x T-1/2" multiplies the Vega by the inverse square root of T (i.e. 1/√T) where T is the number of calendar days to expiry.
Aggregations
Cross over underlying aggregations are calculated in the usual fashion given the new values. Based on the selected Vega aggregation method we support None, Straight Add (SA) and Same Percentage Move (SPM). In SPM mode we summarize individual Vega values multiplied by implied volatility. All aggregation methods convert the values into the base currency of the portfolio.
Custom scenario calculation of volatility index options
Implied Volatility Indices are indexes that are computed real-time basis throughout each trading day just as a regular equity index, but they are measuring volatility and not price. Among the most important ones is CBOE's Marker Volatility Index (VIX). It measures the market's expectation of 30-day volatility implied by S&P 500 Index (SPX) option prices. The calculation estimates expected volatility by averaging the weighted prices of SPX puts and calls over a wide range of strike prices.
The pricing for volatility index options have some differences from the pricing for equity and stock index options. The underlying for such options is the expected, or forward, value of the index at expiration, rather than the current, or "spot" index value. Volatility index option prices should reflect the forward value of the volatility index (which is typically not as volatile as the spot index). Forward prices of option volatility exhibit a "term structure", meaning that the prices of options expiring on different dates may imply different, albeit related, volatility estimates.
For volatility index options like VIX the custom scenario editor of Risk Navigator offers custom adjustment of the VIX spot price and it estimates the scenario forward prices based on the current forward and VR(T) adjusted shock of the scenario adjusted index on the following way.
- Let S0 be the current spot index price, and
- S1 be the adjusted scenario index price.
- If F0 is the current real time forward price for the given option expiry, then
- F1 scenario forward price is F1 = F0 + (S1 - S0) x VR(T), where T is the number of calendar days to expiry.
在哪裡可以瞭解更多有關期權的信息?
期權清算公司(OCC)是所有美國交易所交易之證券期權的中央清算機構,其運營著一個呼叫中心以滿足個人投資者和零售證券經紀商的學習需求。其主要解決由OCC清算之期權產品的下列相關問題:
- 期權行業協會有關研討會、視頻和教學材料的信息;
- 基本期權問題,如期限定義和產品信息;
- 策略和操作性問題(包括特定交易頭寸和策略)解答。
可撥打1-800-OPTIONS聯繫呼叫中心。營業時間為美國中部標準時間週一至週四上午8點到下午5點,週五上午8點到下午4點.每月逢週五到期日營業時間將延長至下午5點。
Complex Position Size
For complex, multi-leg options positions comprising two or more legs, TWS might not track all changes to this position, e.g. a vertical spread where the short leg is assigned and the user re-writes the same leg the next day, or if the user creates a the position over multiple trades, or if the order is not filled as a native combination at the exchange.
盈收
北美上市公司通常要求按季度發佈盈收報告。這些報告包含一系列相關數據(收益和利潤數據),通常可反映公司未來的盈收能力,可能引起公司股票市價的巨大波動。從期權交易的視角看,任何可能導致股票波動的因素都會影響其期權定價。盈收發佈也不例外。
期權交易者常常試圖預期市場對盈收新聞的反應。他們知道隨著盈收發佈日期的臨近,隱含波動率-期權價格的關鍵因素-將穩步上升,而斜線-平價期權與價外期權隱含波動率的差額-也會逐漸變陡。調整幅度通常基於歷史情況而定。過去在盈收發佈后出現重大波動的股票通常期權價格會更高。
盈收風險具有特殊性,這意味著其通常因股票而異,且不易於與指數或同類公司對沖。相互密切關聯的股票其反應可能會大相徑庭,會導致股價偏離或指數衰減。處於這些原因,沒有哪個策略適用於在這些情境下交易期權。交易者必須對股票的可能動向有十分清晰的預期,然後決定哪種期權組合可能會產生最大的利潤。
如果市場對一家公司的盈收預期太過樂觀,很簡單,只需購買(儘管通常比較貴)跨式期權或價外看跌期權并期待市場發生重大變動。在即月隱含波動率過高時利用反向預期也可能盈利,但是這也可能在股票大幅上揚時成為空頭裸期權,從而導致嚴重的損失。交易者可通過購買日曆價差-賣出即月看跌期權并買入下月行使價相同的期權-來利用較高的即月波動率。如果股票以行使價成交,且即月期權下滑速度遠大於價格更高的遠期期權,則會實現最大盈利。損失限制為初始交易價格。
當價外看跌期權隱含波動率日漸高於平價期權,斜線會變得十分陡峭,表明市場過度恐慌。使用垂直價差的交易者可在這種情境下盈利。看跌交易者可以買入平價看跌期權,同時賣出價外看跌期權。這允許買家支付部份高價期權成本,儘管如果股價跌至較低行使價以下,這回超出限制交易利潤。另一方面,認為市場過度看跌的交易者可以賣出價外看跌期權,同時買入行使價更低的看跌期權。儘管交易者買入的是波動率較高的期權,只要股價高於行使價,就能盈利,同時損失也限定在兩個行使價之間的差額。
該文章僅作信息參考,并不旨在提供建議或招攬買賣證券。期權交易涉及重要風險。交易期權前請閱讀“標準期權的特徵和風險。”客戶對其自身的交易決定負全部責任。
到期前行使看漲期權的注意事項
簡介
到期前行使股票看漲期權通常不會帶來收益,因為:
- 這會導致剩餘期權時間價值的丟失;
- 需要更大的資金投入以支付股票交割;並且
- 會給期權持有人帶來更大的損失風險。
儘管如此,對於有能力滿足更高資金或借款要求并能承受更大下行市場風險的帳戶持有人來說,提前行使美式看漲期權行可獲取即將分派的股息。
背景
看漲期權持有人無權獲取底層股票的股息,因為該股息屬於股息登記日前的股票持有人所有。其他條件相同,股價應下降,降幅與除息日的股息保持一致。期權定價理論提出看漲期權價格將反映預期股息的折扣價格,看漲期權價格也可能在除息日下跌。最可能促成該情境與提前行權決定的條件如下:
1. 期權為深度價內期權,且Delta值為100;
2. 期權幾乎沒有時間價值;
3. 股息相對較高,且除息日在期權到期日之前。
舉例
為闡述這些條件對提前行權決定的影響,假設帳戶的多頭現金餘額為$9,000美元,且持有行使價為$90.00美元的ABC多頭看漲頭寸,10天后到期。ABC當前成交價為$100.00美元,每股股息為$2.00美元,明天是除息日。再假設期權價格和股票價格走勢相同,且在除息日下跌的幅度均為股息金額。
這裡,我們將檢查行權決定,目的是維持100股delta頭寸并使用兩種期權價格假設(一個為平價,一個高於平價)最大化總資產。
情境 1:期權價格為平價 - $10.00美元
如果期權以平價交易,提前行權可維持delta頭寸并可避免股票除息交易時多頭期權價值遭到損失,從而保護資產。在這裡現金收入被全數用於以行使價購買股票,期權權利金就此喪失,並且股票(扣除股息)與應收股息會記入帳戶。如果您想通過在除息日前賣出期權并買入股票來達到同樣的效果,請記得考慮佣金/價差:
| 情境 1 | ||||
|
帳戶組成部份 |
起始餘額 |
提前行權 |
無行動 |
賣期權 & 買股票 |
| 現金 | $9,000 | $0 | $9,000 | $0 |
| 期權 | $1,000 | $0 | $800 | $0 |
| 股票 | $0 | $9,800 | $0 | $9,800 |
| 應收股息 | $0 | $200 | $0 | $200 |
| 總資產 | $10,000 | $10,000 | $9,800 | $10,000減去佣金/價差 |
情境 2:期權價格高於平價 - $11.00美元
如果期權以高於平價的價格交易,提前行權獲取股息則可能並不會帶來收益。在此情境中,提前行權可能會導致期權時間價值損失$100美元,而賣出期權買入股票在扣除佣金之後收益情況也可能不如不採取行動。在這裡,可取的行動為無行動。
| 情境 2 | ||||
| 帳戶組成部份 | 起始餘額 | 提前行權 | 無行動 |
賣期權 & 買股票 |
| 現金 | $9,000 | $0 | $9,000 | $100 |
| 期權 | $1,100 | $0 | $1,100 | $0 |
| 股票 | $0 | $9,800 | $0 | $9,800 |
| 應收股息 | $0 | $200 | $0 | $200 |
| 總資產 | $10,100 | $10,000 | $10,100 | $10,100減去佣金/價差 |
![]() 請注意:考慮到空頭期權邊被行權的可能性,持有作為價差組成部分之多頭看漲頭寸的賬戶持有人應格外注意不行使多頭期權邊的風險。請注意,空頭看漲期權的被行權會導致空頭股票頭寸,且在股息登記日前持有空頭股票頭寸的持有人有義務向股票的借出者支付股息。此外,清算所行權通知處理週期不支持提交響應被行權的行權通知。
請注意:考慮到空頭期權邊被行權的可能性,持有作為價差組成部分之多頭看漲頭寸的賬戶持有人應格外注意不行使多頭期權邊的風險。請注意,空頭看漲期權的被行權會導致空頭股票頭寸,且在股息登記日前持有空頭股票頭寸的持有人有義務向股票的借出者支付股息。此外,清算所行權通知處理週期不支持提交響應被行權的行權通知。
例如,假設SPDR S&P 500 ETF Trust (SPY)的信用看漲(熊市)價差包括100張13年3月到期行使價為$146美元的空頭合約,以及100張13年3月到期行使價為$147美元的多頭合約。在13年3月14日,SPY Trust宣布每股股息為$0.69372美元,並且會在13年4月30日向13年3月19日前登記的股東支付。因為美國股票的結算週期為3個工作日,想要獲取股息,交易者需要在13年1月14日之前買入股票或行使看漲期權,因為該日期一過,股票便開始除息交易。
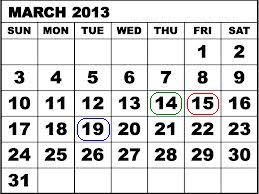
13年3月14日,距離期權到期只剩一個交易日,平價成交的兩張期權合約每張合約的最大風險為$100美元,100張合約則為$10,000美元。但是,未能行使多頭合約以獲取股息以及未能避免空頭合約被其他想要獲取股息的交易者行權會使每張合約產生額外$67.372美元的風險,如果所有空頭看漲合約都被行權,則所有頭寸總風險為$6,737.20美元。如下表所示,如果空頭期權邊沒有被行權,則13年3月15日確定最終的合約結算價格時,最大風險仍為每張合約$100美元。
| 日期 | SPY收盤價 | 3月13日行使價為$146美元的看漲期權 | 3月13日行使價為$147美元的看漲期權 |
| 2013年3月14日 | $156.73 | $10.73 | $9.83 |
| 2013年3月15日 | $155.83 | $9.73 | $8.83 |
請注意,如果您的賬戶符合美國871(m)預扣稅要求,則除息日前平倉頭多期權頭寸並在除息日後重新建倉可能會帶來收益。
有關如何提交提前通知的信息請查看IB網站。
上方內容僅作信息參考,不構成任何推薦或交易建議,也不代表提前行權會成功或適合所有客戶或交易。帳戶持有人應諮詢稅務專家以確定提前行權可能帶來的稅務影響,并應格外注意以多頭股票頭寸替換多頭期權頭寸的潛在風險。
Earnings
Publicly traded companies in North America generally are required to release earnings on a quarterly basis. These announcements, which contain a host of relevant statistics, including revenue and margin data, and often projections about the company's future profitability, have the potential to cause a significant move in the market price of the company's shares. From an options trading viewpoint, anything with the potential to cause volatility in a stock affects the pricing of its options. Earnings releases are no exceptions.
Options traders often try to anticipate the market's reaction to earnings news. They know implied volatilities, the key to options prices, will steadily rise while skew - the difference in implied volatility between at-money and out-of-the-money options - will steadily steepen as the earnings date approaches. The degree by which those adjustments occur is often based on history. Stocks that have historically made significant post-earnings moves often have more expensive options.
Earnings risk is idiosyncratic, meaning that it is usually stock specific and not easily hedged against an index or a similar company. Stocks that are normally quite well correlated may react quite differently, leading to share prices that diverge or indices with dampened moves. For those reasons, there is no single strategy that works for trading options in these situations. Traders must have very clear expectations for a stock's potential move, and then decide which combination of options will likely lead to the most profitable results if the trader is correct.
If the market seems too sanguine about a company's earnings prospects, it is fairly simple (though often costly) to buy a straddle or an out-of the-money put and hope for a big move. Taking advantage of the opposite prospect, when front month implied volatilities seem too high, can also be profitable but it can also cause serious losses to be short naked options in the face of a big upward stock move. Traders can take advantage of high front month volatility by buying a calendar spread - selling a front month put and buying the same strike in the following month. The maximum profit potential is reached if the stock trades at the strike price, with the front-month option decaying far faster than the more expensive longer-term option. Losses are limited to the initial trade price.
Sometimes excessive fear is expressed by extremely steep skew, when out-of-the-money puts display increasingly higher implied volatilities than at-money options. Traders who use vertical spreads can capitalize on this phenomenon. Those who are bearish can buy an at-money put while selling an out-of-the-money put. This allows the purchaser to defray some of the cost of a high priced option, though it caps the trade's profits if the stock declines below the lower strike. On the other hand, those who believe the market is excessively bearish can sell an out-of-the-money put while buying an even lower strike put. Although the trader is buying the higher volatility option, it allows him to make money as long as the stock stays above the higher strike price, while capping his loss at the difference between the two strikes.
This article is provided for information only and is not intended as a recommendation or a solicitation to buy or sell securities. Option trading can involve significant risk. Before trading options read the "Characteristics and Risks of Standardized Options." Customers are solely responsible for their own trading decisions.