Option Levels 1-4
What are the levels of Option Trading Permissions?
IBKR introduced two new, lower levels of option trading permissions, Level 1 and 2, in order to be able to offer option trading to those who currently would not qualify for Limited or Full option trading permissions. Limited permissions are now referred to as Level 3, and Full permissions are considered Level 4.
Please note that clients of IB Canada and IB India are not eligible for option level permissions and remain with Limited or Full option trading permissions.
The type of option strategies available to trade will depend on the level of option permissions approved on the account. The various levels are as follows:
|
Level |
Option Strategies Allowed |
|
Level 1 |
Covered calls, i.e. short call vs long equal quantity of underlying, are allowed. |
|
Level 2 |
Covered Options Positions as defined by FINRA Rule 2360 are allowed with the additional restriction that the expiration date of the long option must be on or after the expiration date of the short option in a spread. |
|
Level 3 |
Option strategies that have limited maximum potential loss are allowed. |
|
Level 4 |
All option strategies are allowed. |
For examples of the types of option combinations allowed in each level, please see the following chart:
|
Strategy |
Level Requirement |
|
Covered Call/Covered Basket Call |
Level 1 |
|
Buy Write |
Level 1 |
|
Long option positions |
Level 2 |
|
Long Call |
Level 2 |
|
Long Put |
Level 2 |
|
Covered Put |
Level 2 |
|
Protective Call |
Level 2 |
|
Protective Put |
Level 2 |
|
Long Straddle |
Level 2 |
|
Long Strangle |
Level 2 |
|
Conversion |
Level 2 |
|
Long call spread |
Level 2 |
|
Long put spread |
Level 2 |
|
Long Iron Condor |
Level 2 |
|
Long Box Spread |
Level 2 |
|
Collar |
Level 2 |
|
Short Collar |
Level 2 |
|
Short Put |
Level 3 |
|
Synthetic |
Level 3 |
|
Reversal |
Level 3 |
|
Short Call Spread |
Level 3 |
|
Short Put Spread |
Level 3 |
|
Short Iron Condor |
Level 3 |
|
Long Butterfly |
Level 3 |
|
Unbalanced Butterfly |
Level 3 |
|
Short Butterfly |
Level 3 |
|
Calendar Spread - Debit |
Level 3 |
|
Diagnol Spread - Short leg expires first |
Level 3 |
|
Short Naked Call |
Level 4 |
|
Short Straddle |
Level 4 |
|
Short Strangle |
Level 4 |
|
Short Synthetic |
Level 4 |
|
Calendar Spread - Credit |
Level 4 |
|
Diagnol Spread - Long leg expires first |
Level 4 |
What account type is needed to trade options?
Option trading permissions are available for Margin, Cash and IRA/Retirement accounts.
A Margin account may request any level of option trading permissions (1-4). A Cash or IRA account may only request levels 1-3, and full payment is required for all call and put purchases.
Please Note
- Clients who maintain either a cash or margin type account must maintain net liquidating equity of at least USD 2,000 (or equivalent in other currencies) in order to establish or increase an existing uncovered options position.
How do I request or update my option trading permissions?
To update your trading permissions for options:
1. Log in to Client Portal
2. Select the User menu (head and shoulders icon in the top right corner) followed by Settings
3. Under Account Settings find the Trading section
4. Click on Trading Permissions
5. Locate Options section, select Add/Edit or Request under Options, select the level of permissions you want to request and click on CONTINUE.
6. Review and sign the disclosures and agreements.
7. Click CONTINUE and follow the prompts on screen.
Trading permission requests may take 24-48 hours to be reviewed. Find more information on trading permissions in the Client Portal Users' Guide.
Please Note
- When only Options permissions are available for a country the permissions will include both Stock and Index Options.
- US legal residents are generally excluded from trading securities options outside of the United States due to SEC restrictions. Securities options are defined as any option on an individual stock, US legal stock, or any cash settled broad based index future.
- Certain option contracts require an additional permission for "Complex or Leveraged Exchange Traded Products".
Is it possible for someone under the age of 21 to trade options?
All clients are eligible for Level 1 options trading permissions. However, IBKR requires that clients be at least 21 years of age to be eligible for level 2-4 option trading.
What are the requirements to qualify for option trading permissions?
IBKR offers various levels of trading permissions to applicants meeting minimum age, liquid net worth, investment objectives, product knowledge and prior experience qualifications. This information is gathered in the account application phase or in Client Portal if a trading permissions upgrade is requested following initial account approval.
If you need to update or review your financial information, investment objectives or experience use the button above or follow this procedure:
1. Log into Client Portal
2. Go to the User menu (head and shoulders icon in the top right corner) followed by Settings
3. Under Account Settings find the Account Profile section
4. Click on Financial Profile, rectify your information and confirm.
オプションのための証拠金計算に使用される公式
オプションの必要証拠金は、様々な数式を使用して計算されます。 どの数式が使用されるかはオプションのタイプ、またはシステムの指定するストラテジーによります。 様々なストラテジーに適用される細かい数式は相当な数存在します。 詳細は IBKRホームページ、www.interactivebrokers.comよりご確認下さい。 取引メニューに進み、証拠金をクリックして下さい。 必要証拠金のページより、オプションのタブをクリックして下さい。 可能なストラテジーすべてと、それぞれに適用される数式がページに表示されます。
上記の情報は、株式オプションと指数オプションに適用されます。 先物のオプションは、SPANマージンと呼ばれる別の方法を使用します。 SPANマージンに関する詳細は、こちらのページより「SPAN」または「先物オプション証拠金」と入力して検索して下さい。
VR(T) time decay and term adjusted Vega columns in Risk Navigator (SM)
Background
Risk Navigator (SM) has two Adjusted Vega columns that you can add to your report pages via menu Metrics → Position Risk...: "Adjusted Vega" and "Vega x T-1/2". A common question is what is our in-house time function that is used in the Adjusted Vega column and what is the aim of these columns. VR(T) is also generally used in our Stress Test or in the Risk Navigator custom scenario calculation of volatility index options (i.e VIX).
Abstract
Implied volatilities of two different options on the same underlying can change independently of each other. Most of the time the changes will have the same sign but not necessarily the same magnitude. In order to realistically aggregate volatility risk across multiple options into a single number, we need an assumption about relationship between implied volatility changes. In Risk Navigator, we always assume that within a single maturity, all implied volatility changes have the same sign and magnitude (i.e. a parallel shift of volatility curve). Across expiration dates, however, it is empirically known that short term volatility exhibits a higher variability than long term volatility, so the parallel shift is a poor assumption. This document outlines our approach based on volatility returns function (VR(T)). We also describe an alternative method developed to accommodate different requests.
VR(T) time decay
We applied the principal component analysis to study daily percentage changes of volatility as a function of time to maturity. In that study we found that the primary eigen-mode explains approximately 90% of the variance of the system (with second and third components explaining most of the remaining variance being the slope change and twist). The largest amplitude of change for the primary eigenvector occurs at very short maturities, and the amplitude monotonically decreases as time to expiration increase. The following graph shows the main eigenvector as a function of time (measured in calendar days). To smooth the numerically obtained curve, we parameterize it as a piecewise exponential function.
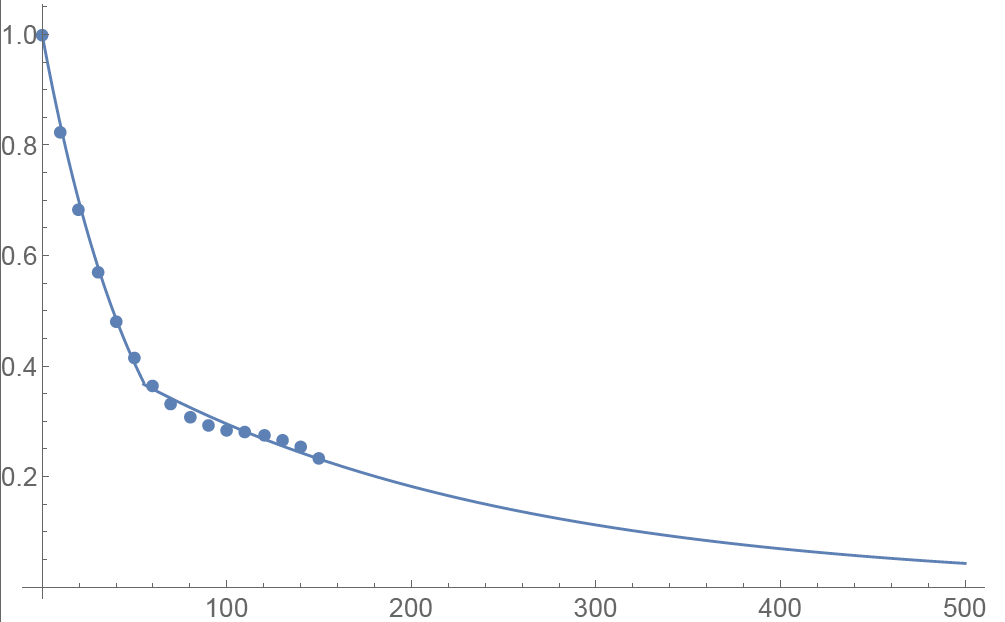
Functional Form: Amplitude vs. Calendar Days
To prevent the parametric function from becoming vanishingly small at long maturities, we apply a floor to the longer term exponential so the final implementation of this function is:

where bS=0.0180611, a=0.365678, bL=0.00482976, and T*=55.7 are obtained by fitting the main eigenvector to the parametric formula.
Inverse square root time decay
Another common approach to standardize volatility moves across maturities uses the factor 1/√T. As shown in the graph below, our house VR(T) function has a bigger volatility changes than this simplified model.
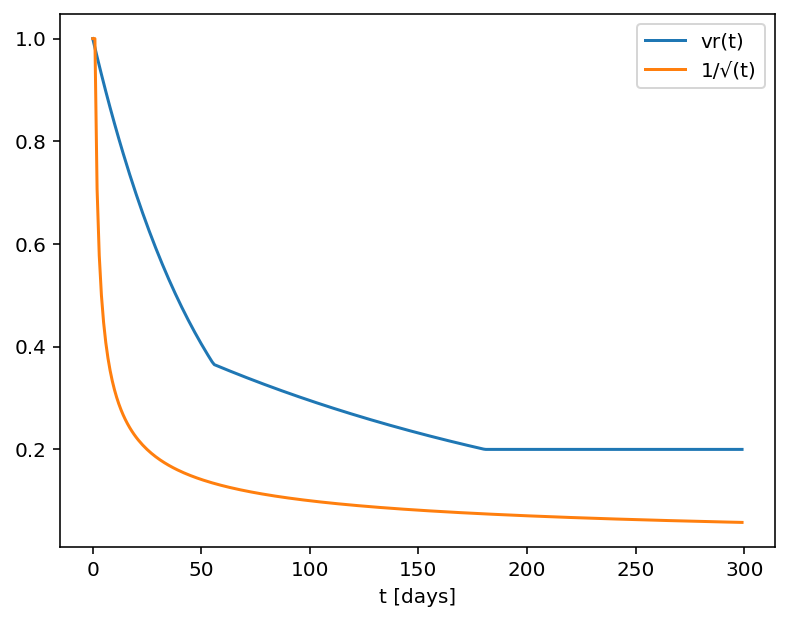
Time function comparison: Amplitude vs. Calendar Days
Adjusted Vega columns
Risk Navigator (SM) reports a computed Vega for each position; by convention, this is the p/l change per 1% increase in the volatility used for pricing. Aggregating these Vega values thus provides the portfolio p/l change for a 1% across-the-board increase in all volatilities – a parallel shift of volatility.
However, as described above a change in market volatilities might not take the form of a parallel shift. Empirically, we observe that the implied volatility of short-dated options tends to fluctuate more than that of longer-dated options. This differing sensitivity is similar to the "beta" parameter of the Capital Asset Pricing Model. We refer to this effect as term structure of volatility response.
By multiplying the Vega of an option position with an expiry-dependent quantity, we can compute a term-adjusted Vega intended to allow more accurate comparison of volatility exposures across expiries. Naturally the hoped-for increase in accuracy can only come about if the adjustment we choose turns out to accurately model the change in market implied volatility.
We offer two parametrized functions of expiry which can be used to compute this Vega adjustment to better represent the volatility sensitivity characteristics of the options as a function of time to maturity. Note that these are also referred as 'time weighted' or 'normalized' Vega.
Adjusted Vega
A column titled "Vega Adjusted" multiplies the Vega by our in-house VR(T) term structure function. This is available any option that is not a derivative of a Volatility Product ETP. Examples are SPX, IBM, VIX but not VXX.
Vega x T-1/2
A column for the same set of products as above titled "Vega x T-1/2" multiplies the Vega by the inverse square root of T (i.e. 1/√T) where T is the number of calendar days to expiry.
Aggregations
Cross over underlying aggregations are calculated in the usual fashion given the new values. Based on the selected Vega aggregation method we support None, Straight Add (SA) and Same Percentage Move (SPM). In SPM mode we summarize individual Vega values multiplied by implied volatility. All aggregation methods convert the values into the base currency of the portfolio.
Custom scenario calculation of volatility index options
Implied Volatility Indices are indexes that are computed real-time basis throughout each trading day just as a regular equity index, but they are measuring volatility and not price. Among the most important ones is CBOE's Marker Volatility Index (VIX). It measures the market's expectation of 30-day volatility implied by S&P 500 Index (SPX) option prices. The calculation estimates expected volatility by averaging the weighted prices of SPX puts and calls over a wide range of strike prices.
The pricing for volatility index options have some differences from the pricing for equity and stock index options. The underlying for such options is the expected, or forward, value of the index at expiration, rather than the current, or "spot" index value. Volatility index option prices should reflect the forward value of the volatility index (which is typically not as volatile as the spot index). Forward prices of option volatility exhibit a "term structure", meaning that the prices of options expiring on different dates may imply different, albeit related, volatility estimates.
For volatility index options like VIX the custom scenario editor of Risk Navigator offers custom adjustment of the VIX spot price and it estimates the scenario forward prices based on the current forward and VR(T) adjusted shock of the scenario adjusted index on the following way.
- Let S0 be the current spot index price, and
- S1 be the adjusted scenario index price.
- If F0 is the current real time forward price for the given option expiry, then
- F1 scenario forward price is F1 = F0 + (S1 - S0) x VR(T), where T is the number of calendar days to expiry.
オプションに関する追加情報の入手元
米国の取引所で取引されるすべての証券オプションの中央決済機関であるオプション清算会社(OCC)は、個人投資家とリテール証券ブローカー用の学習ニーズの答えるコールセンターを設置しています。コールセンターではOCCで決済されるオプション商品に関する下記の様な質問や問題に対応しています:
セミナーやビデオ、またその他の学習機能に関するOptions Industry Councilによる情報、
言葉の定義や商品情報など、オプションに関する基本的な質問、
特定の取引ポジションやストラテジーなどを含める運用関連の質問。
コールセンターへは1-800-OPTIONSの番号でお問い合わせください。対応時間は月曜日から木曜日の午前8時から午後5時(中部標準時)、および金曜日の午前8時から午後4時(中部標準時)までとなっております。また毎月、満期の金曜日は午後5時(中部標準時)までとなっております。
Complex Position Size
For complex, multi-leg options positions comprising two or more legs, TWS might not track all changes to this position, e.g. a vertical spread where the short leg is assigned and the user re-writes the same leg the next day, or if the user creates a the position over multiple trades, or if the order is not filled as a native combination at the exchange.
決済報告
北米で公開取引される企業は通常、四半期ごとの決済報告を義務付けられています。収益や証拠金データ、また会社の将来の見通しなども含めることの多い関連統計資料である決済報告は、株式の市場価格の変動に大きな影響を与える可能性があります。オプション取引の観点からすると、株式にボラティリティを引き起こす可能性のあるものはすべて、そのオプション価格に影響を与えるものとなります。決済報告も例外ではありません。
オプショントレーダーは決済報告に対する市場のリアクションを予想しようとします。アットザマネーとアウトオブザマネーのオプション間のボラティリティ差である傾斜が決済報告日が近づくにつれて着実に急勾配する中、オプション価格のキーとなるインプライド・ボラティリティは着実に上昇します。調整は多くの場合、過去の記録に基いて行われ、決済報告後の変動が過去に大きかった株式は、オプションが高価格であることが頻繁にあります。
決済報告のリスクは独特であり、指数や競合社に対して簡単にはヘッジされず、通常は株式特有のものです。普段は相関性のある株式の株価が分岐する、またはあまり動きのない指数になるなど、予想外の動きを見せることもあります。このため、こういった状況でのオプション取引用のこれというストラテジーはありません。株式の今後の動きに対するはっきりした予想をたて、これが正解であった場合に最大限の結果を導くオプションの組み合わせを選ぶ必要があります。
ある企業の決済報告に対する市場の予想が楽観的過ぎると思われる場合、ストラドルやアウトオブザマネーのプットを購入して(高くつくことが多いですが)、大きな変動を望むこともできます。期近物のインプライド・ボラティリティが高すぎるような時にはこの反対の見通しの利用が有利になることもありますが、株価の上昇に対してオプションが売りのネイキッドになることによって、深刻な損失となる可能性もあります。プットの期近物を売却し翌月に同じ権利行使価格のものを購入して、カレンダースプレッドを購入することにより、ボラティリティの高い期近物を上手く利用することもできます。最大利益の可能性は、期近物のオプションがより高額な長期オプションよりもはるかに速いスピードで低下し、株式が権利行使価格で取引される際に達成されます。損失は初期の取引価格のみに制限されています。
アウトオブザマネーにあるプットのインプライド・ボラティリティが、アットザマネーのオプションのものより上昇していく際に、恐怖が高じて極端に急勾配の傾斜として表れることがあり、バーティカル・スプレッドを利用するトレーダーは、この現象を利用することができます。弱気な場合にはアットザマネーのプットを購入し、またアウトオブザマネーのプットを同時に売却します。株式が権利行使価格より下落した場合には取引収入に限界ができますが、こうすることで高額なオプションにかかる費用を購入者が負担することができます。また逆に、市場が極端に弱気になっているように見える場合には、アウトオブザマネーのプットを売却し、権利行使価格のより低いプットを購入することができます。トレーダーはボラティリティのより高いオプションを購入し、損失をふたつの権利行使価格の差額に留めつつ、株価が高い方の権利行使価格以上である限り、収入を得ることができます。
この記事は情報提供のみを目的とするものであり、有価証券の売買の推奨または勧誘を目的とするものではありません。オプション取引にはリスクが伴う可能性があります。オプション取引を開始する前に「一般的なオプション取引に掛る商品性とリスク」をお読みください。取引決断の全責任はお客様のものとなります。
満期前のコールオプション権利行使について
概要
満期前の株式コールオプションの権利行使は、以下の点により通常は経済的利点がありません:
- オプション・タイムバリューの喪失;
- 株式受け渡しへの支払い、借入にかかる費用の増加;
- オプションプレミアムに関連する株式損失リスクの増加
しかしながら、支払や借入、ダウンサイドのマーケットリスク増加に対応できる口座保有者にとって、アメリカンスタイルのコールオプションの早期権利行使は支払予定の配当金の受け取りが可能なため、経済的利点が発生する可能性があります。
背景
配当金は割り当て日の株式保有者に対して支払われるため、コールオプションの保有者への支払はありません。その他の条件が同じ場合、株価は配当落ち日に配当金分、下落します。オプション価格理論上、コールオプションの価格は限月中、配当金支払い見込みが反映されたものとなりますが、配当落ち日に下落することがあります。この様なシナリオで早期権利行使が好まれる条件は以下のような場合です:
1. オプションがディープ・イン・ザ・マネーでデルタが100
2. オプションのタイムバリューが少額、もしくはゼロ
3. 配当金が比較的高く、配当落ち日がオプション満期日の前にある
例
早期権利行使の影響を例にして見てみます。口座の現金残高が$9,000であり、架空の株式ABCのロング・コール(権利行使価格$90.00)が10日後に満期を迎えると仮定します。ABCの株価は$100.00、配当金額は1株あたり$2.00、権利落ち日は明日であるとします。また、オプション価格と株価の動向は類似しており、権利落ち後に配当金額分下落すると仮定します。
100株のデルタポジションを、パリティ価格でのオプションの売却とパリティ価格以上でのオプションの売却の二つのオプション価格をを想定し、資産の最大化を査定します。
シナリオ1:オプション価格がパリティの時 - $10.00
パリティ価格でオプションが取引されている場合、株式が配当落ち後に資金に変わる際、早期権利行使でポジションデルタを維持し、ロングオプションの損失を避けます。現金は権利行使価格で株式を購入するために使用され、オプションプレミアムは喪失し、株式および配当金受取は口座に反映されます。これは配当落ち日の前にオプションを売却し、株式を購入することで達成できますが、手数用およびスプレッドも考慮してください:
| シナリオ1 | ||||
|
口座 バランス |
当初 バランス |
早期 権利行使 |
アクション 無し |
オプション売 &株式買 |
| 現金 | $9,000 | $0 | $9,000 | $0 |
| オプション | $1,000 | $0 | $800 | $0 |
| 株式 | $0 | $9,800 | $0 | $9,800 |
| 配当金受取 | $0 | $200 | $0 | $200 |
| 資産合計 | $10,000 | $10,000 | $9,800 | $10,000 |
シナリオ2:オプション価格がパリティ価格より上の時 - $11.00
パリティ価格以上でオプションが取り引きされる場合、配当金確保のための早期権利行使には経済的利点がない場合があります。このシナリオでは早期権利行使によりオプション・タイムバリューに$100の損失が発生しますが、オプションを売却して株式を購入した場合、手数料を差し引いた結果、アクションを取らない方がかえって良い可能性もあります。この場合、最も好まれるアクションはオプションを取らないことです。
| シナリオ2 | ||||
|
口座 バランス |
当初 バランス |
早期 権利行使 |
アクション 無し |
オプション売 |
| 現金 | $9,000 | $0 | $9,000 | $100 |
| オプション | $1,100 | $0 | $900 | $0 |
| 株式 | $0 | $9,800 | $0 | $9,800 |
| 配当金受取 | $0 | $200 | $0 | $200 |
| 資産合計 | $10,100 | $10,000 | $9,900 | $10,100 |
![]() 注意: ロングコール・ポジションをスプレッド取引の一部として保有している場合には、ショートポジションの割り当てが発生した際に、ロングポジションの権利行使を行わないリスクに特に注意を払う必要があります。割り当て日に株式ショートポジションを保有していて、ショートコールの割り当てが発生した場合、株式の貸し手に配当金を支払う義務が発生しますのでご注意ください。また、権利行使処理を行うクリアリング機関は、割り当ての対応として権利行使処理を行いません。
注意: ロングコール・ポジションをスプレッド取引の一部として保有している場合には、ショートポジションの割り当てが発生した際に、ロングポジションの権利行使を行わないリスクに特に注意を払う必要があります。割り当て日に株式ショートポジションを保有していて、ショートコールの割り当てが発生した場合、株式の貸し手に配当金を支払う義務が発生しますのでご注意ください。また、権利行使処理を行うクリアリング機関は、割り当ての対応として権利行使処理を行いません。
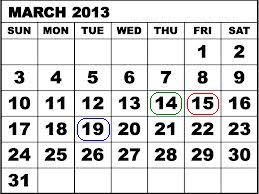
例:SPDR S&P 500 ETF Trust(SPY)のショート100枚(March '13 権利行使$146)とロング100枚(March '13 権利行使$147)を含むクレジットコール(ベア)スプレッドを例にとって考えて見ます。2013年3月14日に1株あたり$0.69372の配当金が発表されたとします。2013年3月19日付で、20134月30日支払の配当金支払見込みが株主の口座に反映されました。米国株式の3営業日決済により、配当金を受け取るには2013年3月14日までに株式の購入、もしくはコールオプションの権利行使を行わなければなりません。それ以降は配当落ち株式となります。
2013年3月14日には満期まで取引日が1日しか残されていません。二つのオプションはパリティ価格で取引され、1枚当たり$100、または100枚のポジションに$10,00の最大リスクが伴います。しかし、配当金の受け取りと、配当金受取を見込んだ、相手方の割り当てからの保護としてのロングコールの権利行使に失敗するとショートコール割り当てに対する配当金支払い義務が発生し、1枚当たり$67.372、または100枚のポジションに$6,737.20の追加のリスクが発生します。以下の表の通り、ショートコール・オプションの割り当てが発生しなかった場合、ポジションの最終決済価格が2013年3月15日に決定し、最大損失リスクは1枚あたり$100に留まります。
| 期日 | SPY 終値 | March '13 $146 コール | March '13 $147 コール |
| March 14, 2013 | $156.73 | $10.73 | $9.83 |
| March 15, 2013 | $155.83 | $9.73 | $8.83 |
お持ちのお口座が米国債ルール871(m)により米国源泉徴収税の対象となっている場合、権利落ち日前に一度ロングポジションをクローズし、権利落ち日後に再度オープンされることにより、効果的に作用する可能性があります。
早期権利行使通知の提出方法については弊社ウェブサイトをご確認ください。
このページは情報提供のみを目的とするものであり、推奨や取引アドバイスではなく、早期権利行使がすべてのお客様やトレーダーに適していることを結論付けるものではありません。口座を保有されるお客様は専門の税理士にご相談の上、早期権利行使による課税への影響をご確認ください。また、ロングポジションの変わりに株式ポジションを保有するにあたって発生する可能性のあるリスクにご注意ください。
Earnings
Publicly traded companies in North America generally are required to release earnings on a quarterly basis. These announcements, which contain a host of relevant statistics, including revenue and margin data, and often projections about the company's future profitability, have the potential to cause a significant move in the market price of the company's shares. From an options trading viewpoint, anything with the potential to cause volatility in a stock affects the pricing of its options. Earnings releases are no exceptions.
Options traders often try to anticipate the market's reaction to earnings news. They know implied volatilities, the key to options prices, will steadily rise while skew - the difference in implied volatility between at-money and out-of-the-money options - will steadily steepen as the earnings date approaches. The degree by which those adjustments occur is often based on history. Stocks that have historically made significant post-earnings moves often have more expensive options.
Earnings risk is idiosyncratic, meaning that it is usually stock specific and not easily hedged against an index or a similar company. Stocks that are normally quite well correlated may react quite differently, leading to share prices that diverge or indices with dampened moves. For those reasons, there is no single strategy that works for trading options in these situations. Traders must have very clear expectations for a stock's potential move, and then decide which combination of options will likely lead to the most profitable results if the trader is correct.
If the market seems too sanguine about a company's earnings prospects, it is fairly simple (though often costly) to buy a straddle or an out-of the-money put and hope for a big move. Taking advantage of the opposite prospect, when front month implied volatilities seem too high, can also be profitable but it can also cause serious losses to be short naked options in the face of a big upward stock move. Traders can take advantage of high front month volatility by buying a calendar spread - selling a front month put and buying the same strike in the following month. The maximum profit potential is reached if the stock trades at the strike price, with the front-month option decaying far faster than the more expensive longer-term option. Losses are limited to the initial trade price.
Sometimes excessive fear is expressed by extremely steep skew, when out-of-the-money puts display increasingly higher implied volatilities than at-money options. Traders who use vertical spreads can capitalize on this phenomenon. Those who are bearish can buy an at-money put while selling an out-of-the-money put. This allows the purchaser to defray some of the cost of a high priced option, though it caps the trade's profits if the stock declines below the lower strike. On the other hand, those who believe the market is excessively bearish can sell an out-of-the-money put while buying an even lower strike put. Although the trader is buying the higher volatility option, it allows him to make money as long as the stock stays above the higher strike price, while capping his loss at the difference between the two strikes.
This article is provided for information only and is not intended as a recommendation or a solicitation to buy or sell securities. Option trading can involve significant risk. Before trading options read the "Characteristics and Risks of Standardized Options." Customers are solely responsible for their own trading decisions.
Considerations for Exercising Call Options Prior to Expiration
INTRODUCTION
Exercising an equity call option prior to expiration ordinarily provides no economic benefit as:
- It results in a forfeiture of any remaining option time value;
- Requires a greater commitment of capital for the payment or financing of the stock delivery; and
- May expose the option holder to greater risk of loss on the stock relative to the option premium.
Nonetheless, for account holders who have the capacity to meet an increased capital or borrowing requirement and potentially greater downside market risk, it can be economically beneficial to request early exercise of an American Style call option in order to capture an upcoming dividend.
BACKGROUND
As background, the owner of a call option is not entitled to receive a dividend on the underlying stock as this dividend only accrues to the holders of stock as of its dividend Record Date. All other things being equal, the price of the stock should decline by an amount equal to the dividend on the Ex-Dividend date. While option pricing theory suggests that the call price will reflect the discounted value of expected dividends paid throughout its duration, it may decline as well on the Ex-Dividend date. The conditions which make this scenario most likely and the early exercise decision favorable are as follows:
1. The option is deep-in-the-money and has a delta of 100;
2. The option has little or no time value;
3. The dividend is relatively high and its Ex-Date precedes the option expiration date.
EXAMPLES
To illustrate the impact of these conditions upon the early exercise decision, consider an account maintaining a long cash balance of $9,000 and a long call position in hypothetical stock “ABC” having a strike price of $90.00 and time to expiration of 10 days. ABC, currently trading at $100.00, has declared a dividend of $2.00 per share with tomorrow being the Ex-Dividend date. Also assume that the option price and stock price behave similarly and decline by the dividend amount on the Ex-Date.
Here, we will review the exercise decision with the intent of maintaining the 100 share delta position and maximizing total equity using two option price assumptions, one in which the option is selling at parity and another above parity.
SCENARIO 1: Option Price At Parity - $10.00
In the case of an option trading at parity, early exercise will serve to maintain the position delta and avoid the loss of value in long option when the stock trades ex-dividend, to preserve equity. Here the cash proceeds are applied in their entirety to buy the stock at the strike, the option premium is forfeited and the stock (net of dividend) and dividend receivable are credited to the account. If you aim for the same end result by selling the option prior to the Ex-Dividend date and purchasing the stock, remember to factor in commissions/spreads:
| SCENARIO 1 | ||||
|
Account Components |
Beginning Balance |
Early Exercise |
No Action |
Sell Option & Buy Stock |
| Cash | $9,000 | $0 | $9,000 | $0 |
| Option | $1,000 | $0 | $800 | $0 |
| Stock | $0 | $9,800 | $0 | $9,800 |
| Dividend Receivable | $0 | $200 | $0 | $200 |
| Total Equity | $10,000 | $10,000 | $9,800 | $10,000 less commissions/spreads |
SCENARIO 2: Option Price Above Parity - $11.00
In the case of an option trading above parity, early exercise to capture the dividend may not be economically beneficial. In this scenario, early exercise would result in a loss of $100 in option time value, while selling the option and buying the stock, after commissions, may be less beneficial than taking no action. In this scenario, the preferable action would be No Action.
| SCENARIO 2 | ||||
|
Account Components |
Beginning Balance |
Early Exercise |
No Action |
Sell Option & Buy Stock |
| Cash | $9,000 | $0 | $9,000 | $100 |
| Option | $1,100 | $0 | $1,100 | $0 |
| Stock | $0 | $9,800 | $0 | $9,800 |
| Dividend Receivable | $0 | $200 | $0 | $200 |
| Total Equity | $10,100 | $10,000 | $10,100 | $10,100 less commissions/spreads |
![]() NOTE: Account holders holding a long call position as part of a spread should pay particular attention to the risks of not exercising the long leg given the likelihood of being assigned on the short leg. Note that the assignment of a short call results in a short stock position and holders of short stock positions as of a dividend Record Date are obligated to pay the dividend to the lender of the shares. In addition, the clearinghouse processing cycle for exercise notices does not accommodate submission of exercise notices in response to assignment.
NOTE: Account holders holding a long call position as part of a spread should pay particular attention to the risks of not exercising the long leg given the likelihood of being assigned on the short leg. Note that the assignment of a short call results in a short stock position and holders of short stock positions as of a dividend Record Date are obligated to pay the dividend to the lender of the shares. In addition, the clearinghouse processing cycle for exercise notices does not accommodate submission of exercise notices in response to assignment.
As example, consider a credit call (bear) spread on the SPDR S&P 500 ETF Trust (SPY) consisting of 100 short contracts in the March '13 $146 strike and 100 long contracts in the March '13 $147 strike. On 3/14/13, with the SPY Trust declared a dividend of $0.69372 per share, payable 4/30/13 to shareholders of record as of 3/19/13. Given the 3 business day settlement time frame for U.S. stocks, one would have had to buy the stock or exercise the call no later than 3/14/13 in order receive the dividend, as the next day the stock began trading Ex-Dividend.
On 3/14/13, with one trading day left prior to expiration, the two option contracts traded at parity, suggesting maximum risk of $100 per contract or $10,000 on the 100 contract position. However, the failure to exercise the long contract in order to capture the dividend and protect against the likely assignment on the short contracts by others seeking the dividend created an additional risk of $67.372 per contract or $6,737.20 on the position representing the dividend obligation were all short calls assigned. As reflected on the table below, had the short option leg not been assigned, the maximum risk when the final contract settlement prices were determined on 3/15/13 would have remained at $100 per contract.
| Date | SPY Close | March '13 $146 Call | March '13 $147 Call |
| March 14, 2013 | $156.73 | $10.73 | $9.83 |
| March 15, 2013 | $155.83 | $9.73 | $8.83 |
Please note that if your account is subject to tax withholding requirements of the US Treasure rule 871(m), it may be beneficial to close a long option position before the ex-dividend date and re-open the position after ex-dividend.
For information regarding how to submit an early exercise notice please click here.
The above article is provided for information purposes only as is not intended as a recommendation, trading advice nor does it constitute a conclusion that early exercise will be successful or appropriate for all customers or trades. Account holders should consult with a tax specialist to determine what, if any, tax consequences may result from early exercise and should pay particular attention to the potential risks of substituting a long option position with a long stock position.